Published
- 2 min read

Question: The data points show a plant’s volume \( y \) (in cubic centimeters) when it has been given an…
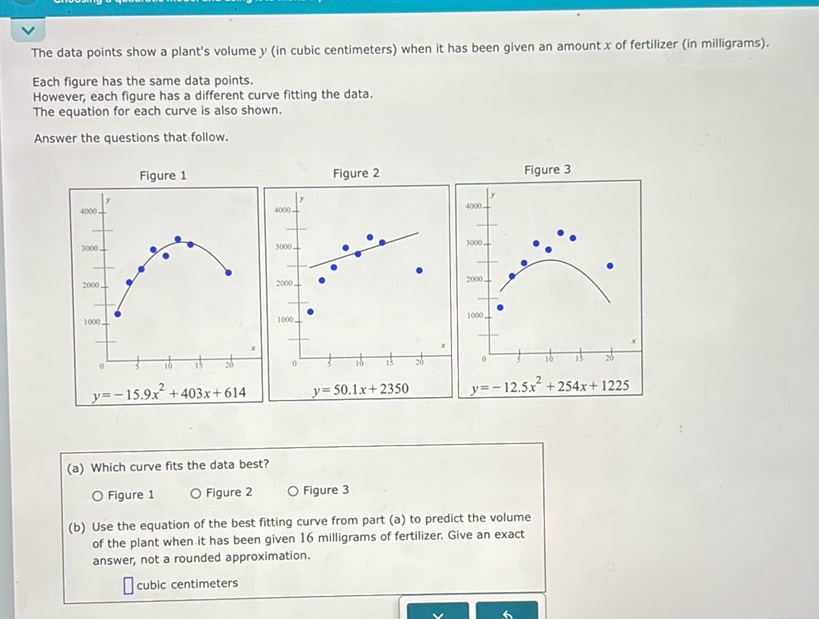
The data points show a plant’s volume \( y \) (in cubic centimeters) when it has been given an amount \( x \) of fertilizer (in milligrams).
Each figure has the same data points. However, each figure has a different curve fitting the data. The equation for each curve is also shown.
Answer the questions that follow.
Figure 1 \[ y = -15.9x^2 + 403x + 614 \]
Figure 2 \[ y = 50.1x + 2350 \]
Figure 3 \[ y = -12.5x^2 + 254x + 1225 \]
(a) Which curve fits the data best?
- Figure 1
- Figure 2
- Figure 3
(b) Use the equation of the best fitting curve from part (a) to predict the volume of the plant when it has been given 16 milligrams of fertilizer. Give an exact answer, not a rounded approximation.
- cubic centimeters
Solution
The question asks which curve fits the data best and to use that curve’s equation to predict a value. (a) By visually inspecting the graphs: - Figure 1 fits the data points well with a clear quadratic curve. - Figure 2 is linear and doesn’t fit the curvature as well. - Figure 3 also fits relatively well, but Figure 1 appears closer to the data points. Thus, the best fitting curve is in Figure 1. (b) Use the equation from Figure 1 to predict the volume when given 16 milligrams of fertilizer. The equation from Figure 1 is: \[ y = -15.9x^2 + 403x + 614 \] Plug in \( x = 16 \): \[ y = -15.9(16)^2 + 403(16) + 614 \] Calculate \( 16^2 \): \[ 16^2 = 256 \] Calculate \( -15.9 \times 256 \): \[ -15.9 \times 256 = -4060.8 \] Calculate \( 403 \times 16 \): \[ 403 \times 16 = 6448 \] Add the results: \[ y = -4060.8 + 6448 + 614 \] \[ y = 3001.2 \] The predicted volume of the plant is 3001.2 cubic centimeters.

