Published
- 2 min read

Question: Question 2 LuLu wants to analyze the relationship between its monthly advertising expenditure…
Question 2
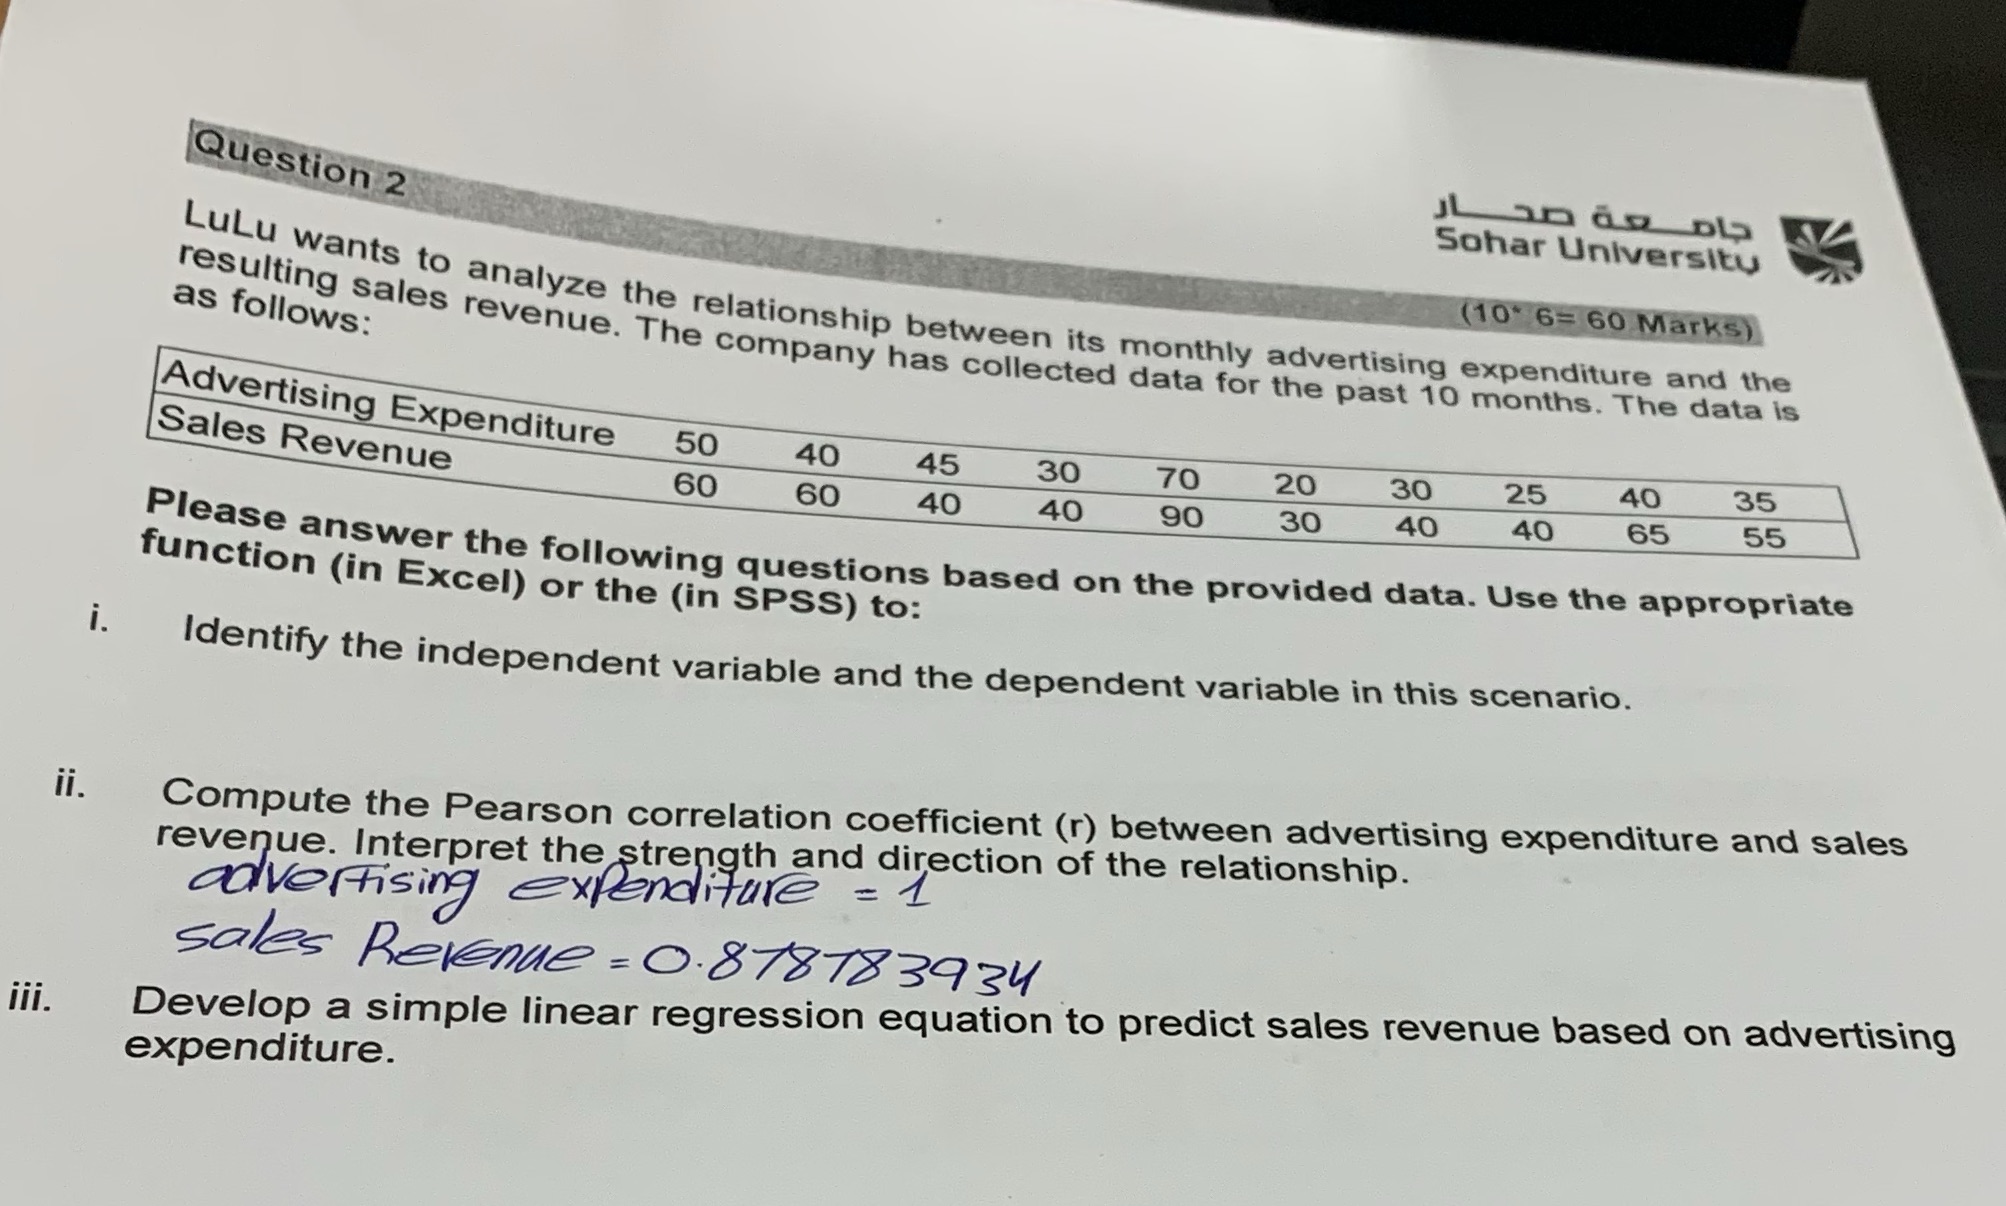
LuLu wants to analyze the relationship between its monthly advertising expenditure and the resulting sales revenue. The company has collected data for the past 10 months. The data is as follows:
| Advertising Expenditure | 50 | 40 | 45 | 30 | 70 | 20 | 30 | 25 | 40 | 35 |
|---|---|---|---|---|---|---|---|---|---|---|
| Sales Revenue | 60 | 60 | 40 | 40 | 90 | 30 | 40 | 40 | 65 | 55 |
Please answer the following questions based on the provided data. Use the appropriate function (in Excel) or the (in SPSS) to:
i. Identify the independent variable and the dependent variable in this scenario.
ii. Compute the Pearson correlation coefficient (r) between advertising expenditure and sales revenue. Interpret the strength and direction of the relationship.
iii. Develop a simple linear regression equation to predict sales revenue based on advertising expenditure.
Handwritten Notes:
- advertising expenditure = 1
- sales revenue = 0.878783934
Solution
i. The independent variable is the Advertising Expenditure, and the dependent variable is the Sales Revenue. ii. The Pearson correlation coefficient \( r \) between advertising expenditure and sales revenue is given as \(-0.878783934\). This negative correlation indicates a strong inverse relationship, meaning as advertising expenditure increases, sales revenue tends to decrease. iii. To develop a simple linear regression equation, we use the formula: \[ y = mx + c \] where \( y \) is the dependent variable (sales revenue), \( x \) is the independent variable (advertising expenditure), \( m \) is the slope, and \( c \) is the y-intercept. To calculate the slope \( m \) and intercept \( c \), we can use the formulas: \[ m = r \frac{s_y}{s_x} \] \[ c = \bar{y} - m \bar{x} \] where \( s_y \) and \( s_x \) are the standard deviations of the sales revenue and advertising expenditure, respectively, and \( \bar{y} \) and \( \bar{x} \) are their means. Given the correlation, you would need to calculate \( m \) and \( c \) using data analysis software like Excel or SPSS to find the complete regression equation.

