Published
- 1 min read

Question: Indicate which of the following four graphs is the correct graph of this function: \[ r(x) =…
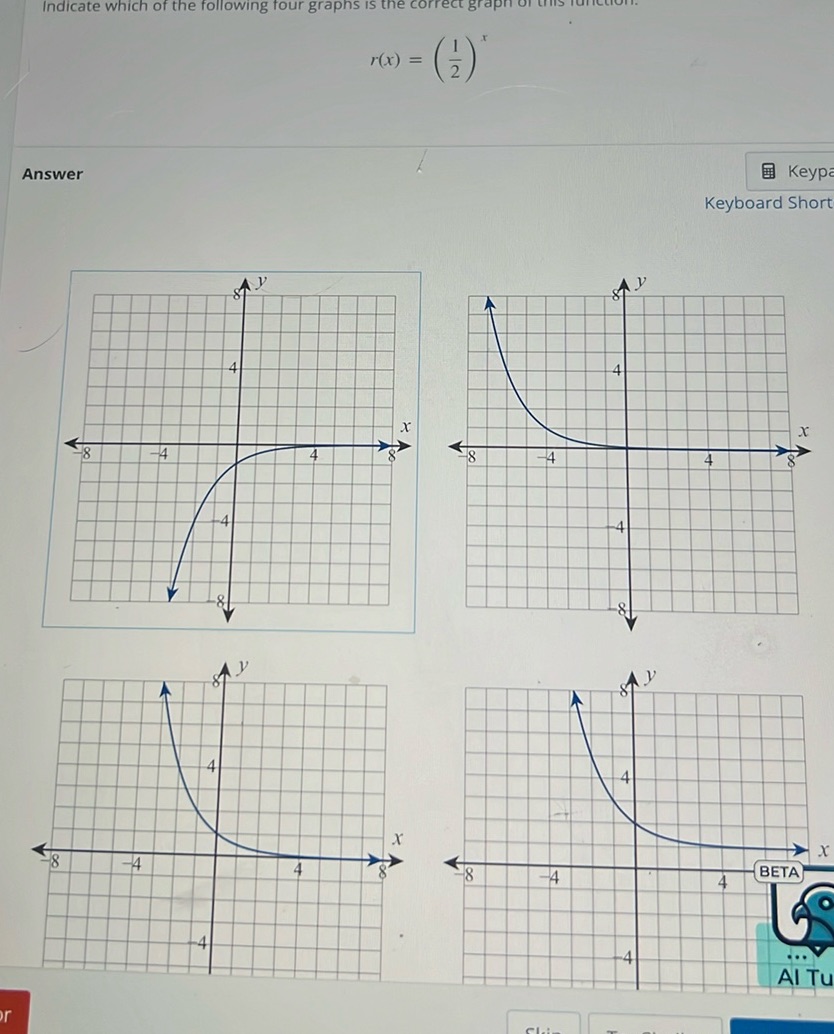
Indicate which of the following four graphs is the correct graph of this function:
\[ r(x) = \left( \frac{1}{2} \right)^x \]
Answer
[Graphs are shown, but not transcribed as they are visual representations.]
Solution
The function given is \[ r(x) = \left( \frac{1}{2} \right)^x \] This is an exponential decay function. Step 1: Identify the general behavior of the graph. Exponential decay means as \(x\) increases, \(r(x)\) decreases, approaching zero. Step 2: Determine the y-intercept. When \(x=0\): \[ r(0) = \left( \frac{1}{2} \right)^0 = 1 \] The graph intersects the y-axis at \(y=1\). Step 3: Identify the asymptotic behavior. As \(x \to \infty\), \(r(x) \to 0\). Step 4: Select the correct graph. The graph should start at \(y=1\) when \(x=0\) and approach the x-axis as \(x\) increases. The correct graph shows this exponential decay behavior. The correct graph is the one showing this downward curve starting at \(y=1\) at \(x=0\) and trending towards the x-axis. This appears to be the top right graph.

