Published
- 2 min read

Question: Graph the following function. Determine the asymptotes, if any. List the domain and the…
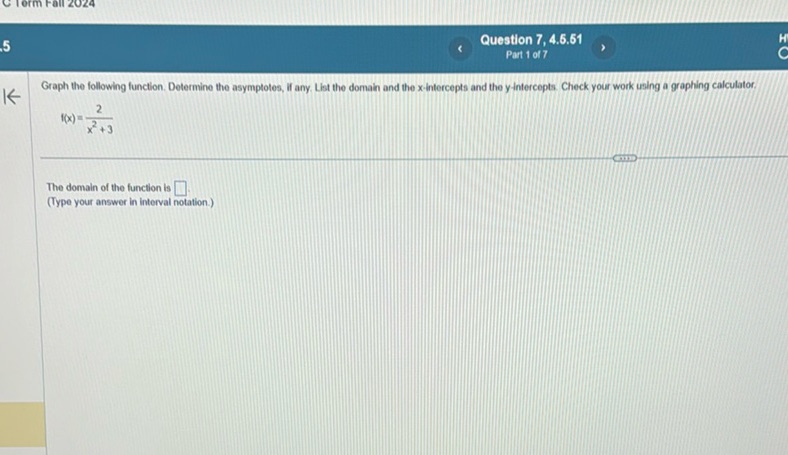
Graph the following function. Determine the asymptotes, if any. List the domain and the x-intercepts and the y-intercepts. Check your work using a graphing calculator.
\[ f(x) = \frac{2}{x^2 + 3} \]
The domain of the function is
(Type your answer in interval notation.)
Solution
To graph the function, \( f(x) = \frac{1}{x^2 + 3} \). First, determine the domain. \[ x^2 + 3 \ne 0 \] This implies \( x^2 \ne -3 \). Since \( x^2 \) is always non-negative, there are no real values of \( x \) that make the denominator zero. \[ \text{Domain: } (-\infty, \infty) \] Next, determine the asymptotes. As \( x \) approaches \( \pm\infty \), \( f(x) \) approaches 0. \[ \text{Horizontal asymptote: } y = 0 \] There are no vertical asymptotes since the denominator is never zero. Next, find the x-intercepts. Set \( f(x) = 0 \). \[ \frac{1}{x^2 + 3} = 0 \] This equation has no solution because \( \frac{1}{x^2 + 3} \) cannot be zero. Thus, there are no x-intercepts. Next, find the y-intercept. Set \( x = 0 \). \[ f(0) = \frac{1}{0^2 + 3} = \frac{1}{3} \] Thus, the y-intercept is at \( \left(0, \frac{1}{3}\right) \). Finally, to graph the function: - Plot the y-intercept at \( \left(0, \frac{1}{3}\right) \). - Draw the horizontal asymptote \( y = 0 \). - Since the function is always positive and approaches the asymptote as \( |x| \) increases, sketch the curve accordingly.

