Published
- 1 min read

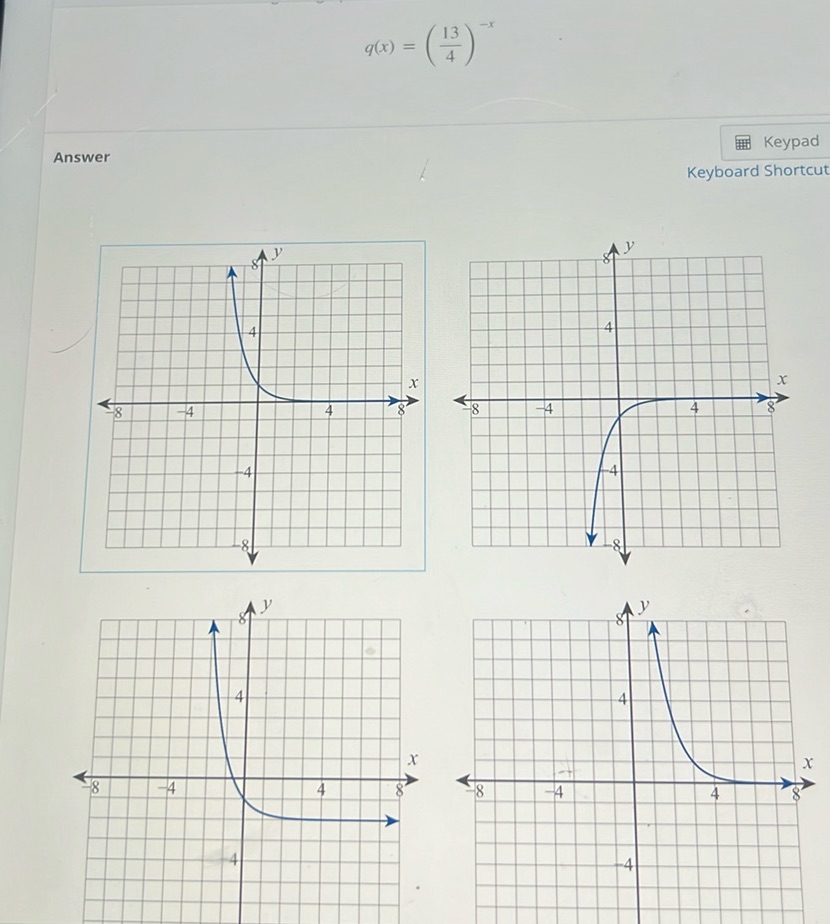
Question: The image contains a mathematical problem involving the function \( q(x) = \left( \frac{13}{4}…
The image contains a mathematical problem involving the function \( q(x) = \left( \frac{13}{4} \right)^{-x} \). Below the function, there are four graphs labeled as options. Each graph is plotted on a coordinate plane with the x-axis and y-axis ranging from -8 to 8. The graphs show different exponential functions, but the specific details of each graph are not transcribed here.
Solution
The problem is to identify which graph corresponds to the function \[ q(x) = \left(\frac{13}{4}\right)^{-x} \] This function is an exponential decay function because the base \(\frac{13}{4} > 1\) and the exponent is negative. 1. Start by rewriting the function: \[ q(x) = \left(\frac{13}{4}\right)^{-x} = \left(\frac{4}{13}\right)^{x} \] 2. Since \(\left(\frac{4}{13}\right)^{x}\) is an exponential function where \(0 < \frac{4}{13} < 1\), it represents exponential decay. 3. The graph should approach the x-axis as \(x\) increases and rise steeply as \(x\) decreases. 4. Among the graphs provided, the one showing this behavior is in the bottom right corner.

