Published
- 1 min read

Question: Indicate which of the following four graphs is the correct graph of this function. \[ h(x) =…
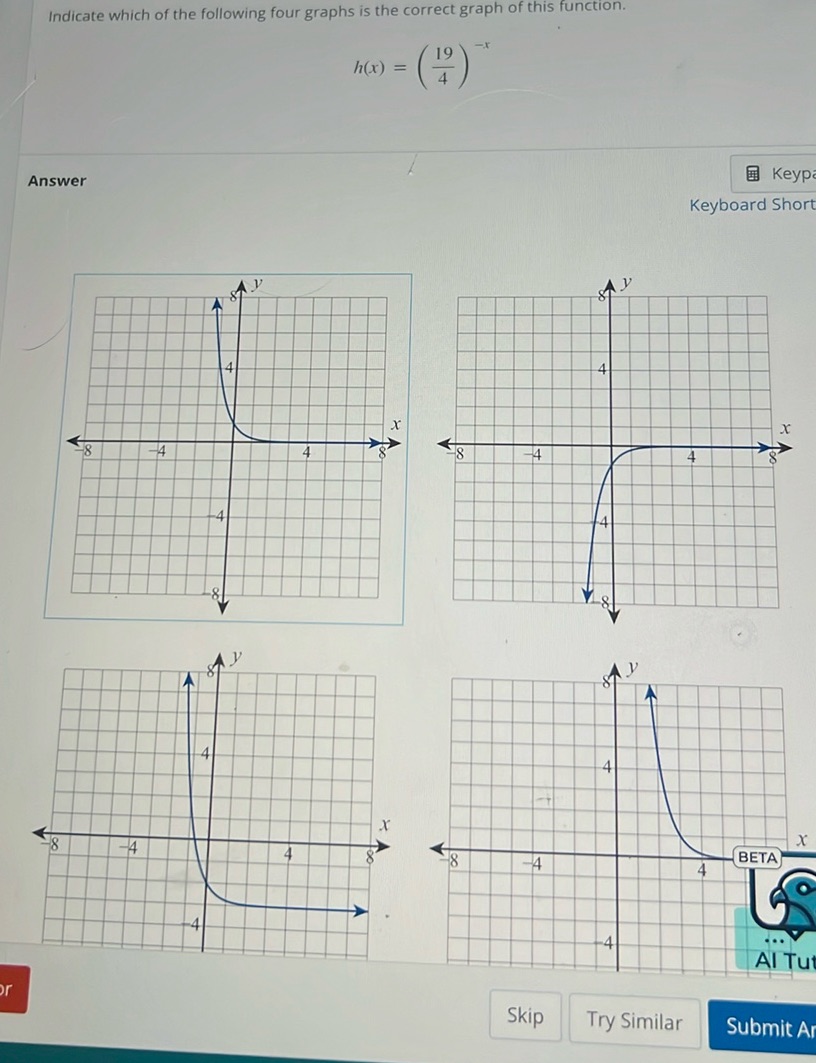
Indicate which of the following four graphs is the correct graph of this function.
\[ h(x) = \left( \frac{19}{4} \right)^{-x} \]
Answer
[Graphs are shown, but not transcribed as they are visual representations.]
Solution
To determine the correct graph for the function \[ h(x) = \left(\frac{19}{4}\right)^{-x} \] we should analyze the behavior of this exponential function. An exponential function of the form \(h(x) = a^{-x}\) where \(a > 1\) is a decreasing function. This means as \(x\) increases, \(h(x)\) decreases. Since the base \(\frac{19}{4} > 1\), the function \(h(x)\) is decreasing. The key characteristics of the graph should include: 1. The curve approaches 0 as \(x\) goes to infinity (horizontal asymptote at \(y = 0\)). 2. The curve increases rapidly as \(x\) goes to negative infinity. Looking at the provided graphs, the correct graph is the one that decreases as \(x\) increases, going from a high value when \(x\) is negative to approaching 0 as \(x\) becomes positive. The correct graph will match the description above and should display exponential decay. From the images shown, it is most likely the graph that mirrors these behaviors.

